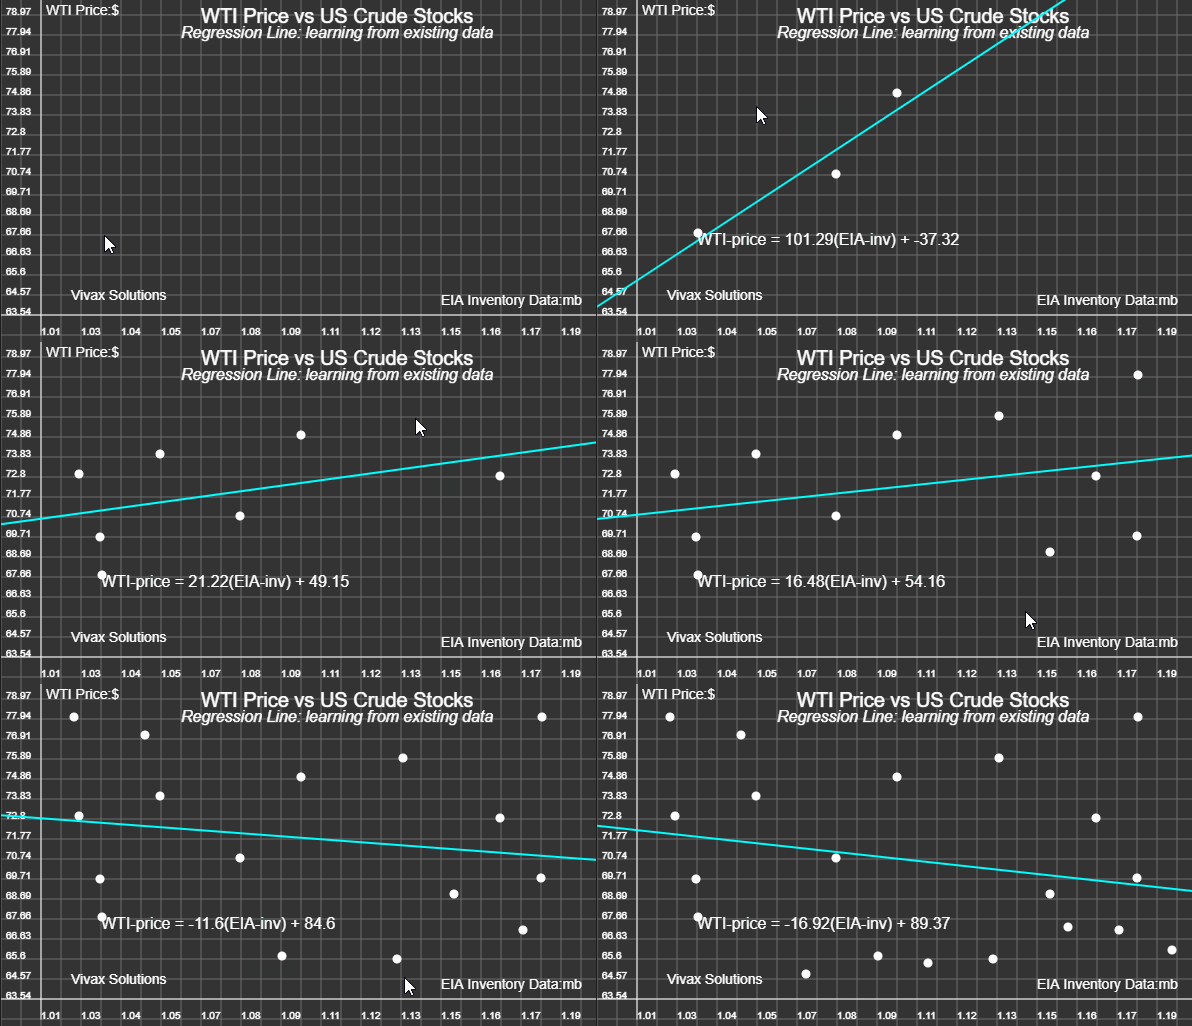
The above animation shows how a code snippet written in JavaScript
determines the line of best fit for an evolving set of data.
The line is drawn accurately while performing the mathematical requirements for it to be accurate and minimizing the known errors.
This is a stepping stone to AI - Artificial Intelligence - that can be best described as the ML - machine learning.
In this case, the machine is learning from its own experience in plotting the dots on the grid.
All you have to do is clicking at random points on the grid; the sketching the line of best is the responsibility of the programme.
You can practise and have fun on your own here:


0 comments:
Post a Comment