Snell's Law When light refracts from one medium to another, the ratio of sine of the angles is equal to the ratio of refractive index of each corresponding medium. Snell's Law implies that light, when refracting from one medium to another, takes the shortest path. We can show by differentiatio…
Friday, 30 December 2022
Tuesday, 27 December 2022
Pascal's Triangle in Python for Computer Science: GCSE, IGCSE and A Level
The above simulation is produced in Python with aid of three functions. They are as follows: Factorial function A function to generate combinations - nCr A function to produce the Pascal's Triangle You can practise it interactively with the following simulation. Please make sure you keep the number…
Straight Line Graph Generator for Maths Teachers: GCSE, IGCSE, GCE O Level, GCE A Level, A Level
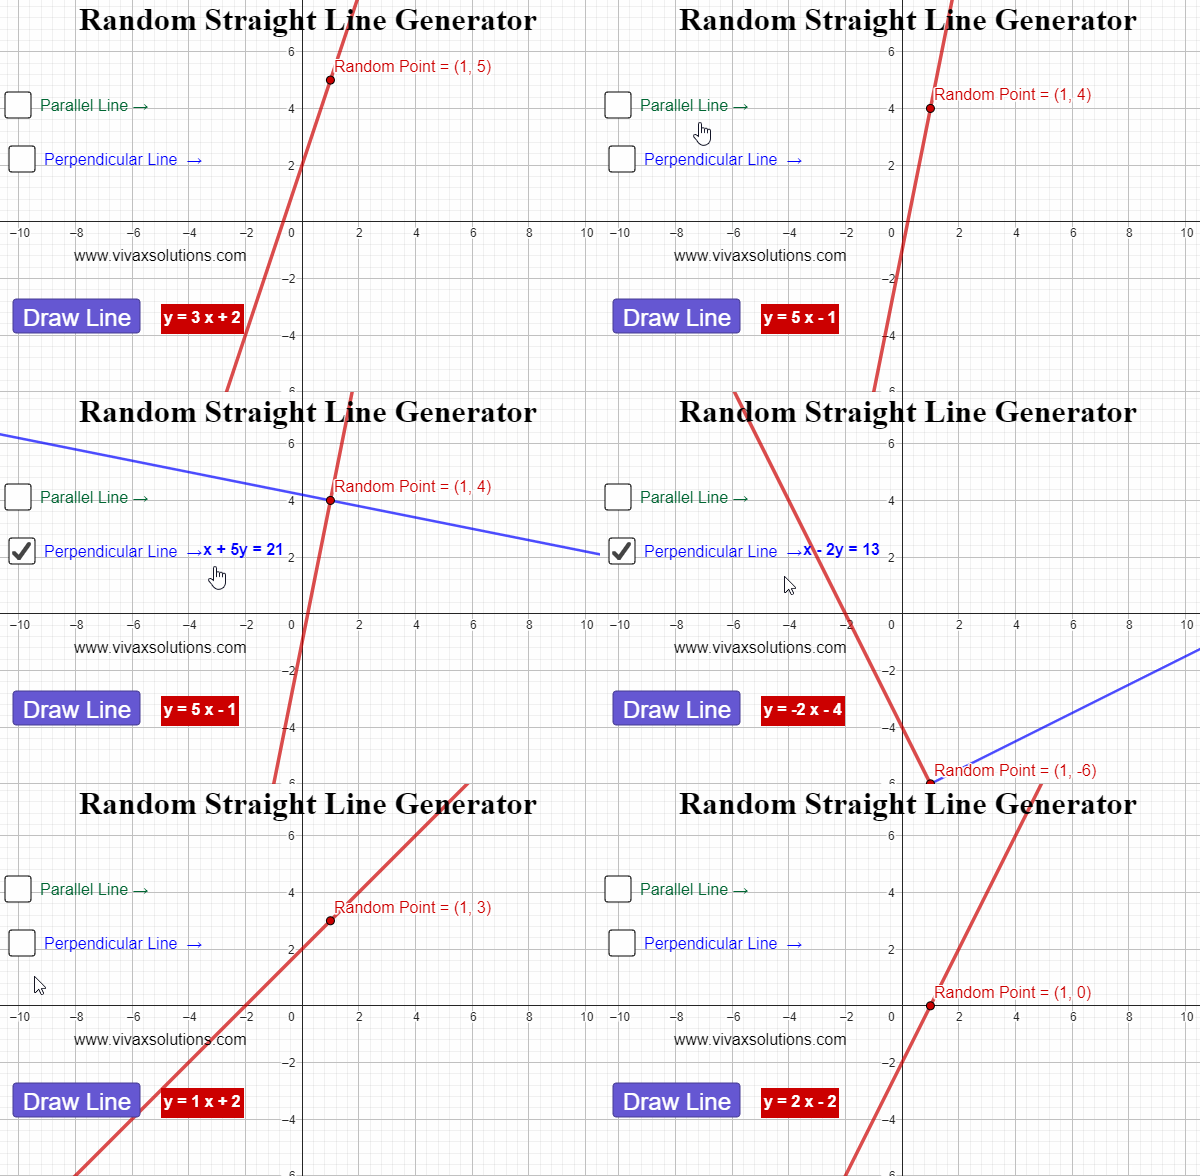
Created with GeoGebra, this applet lets you generate straight line graphs at random, displaying the corresponding equation for each. In addition, you can find a parallel line - and its equation - for each line. Moreover, for each generated line, a random point is created. Then, the perpendicular line…
Friday, 23 December 2022
Creating Pascal's Triangle in C#: for computer science at GCSE, IGCE, A Level and programmers
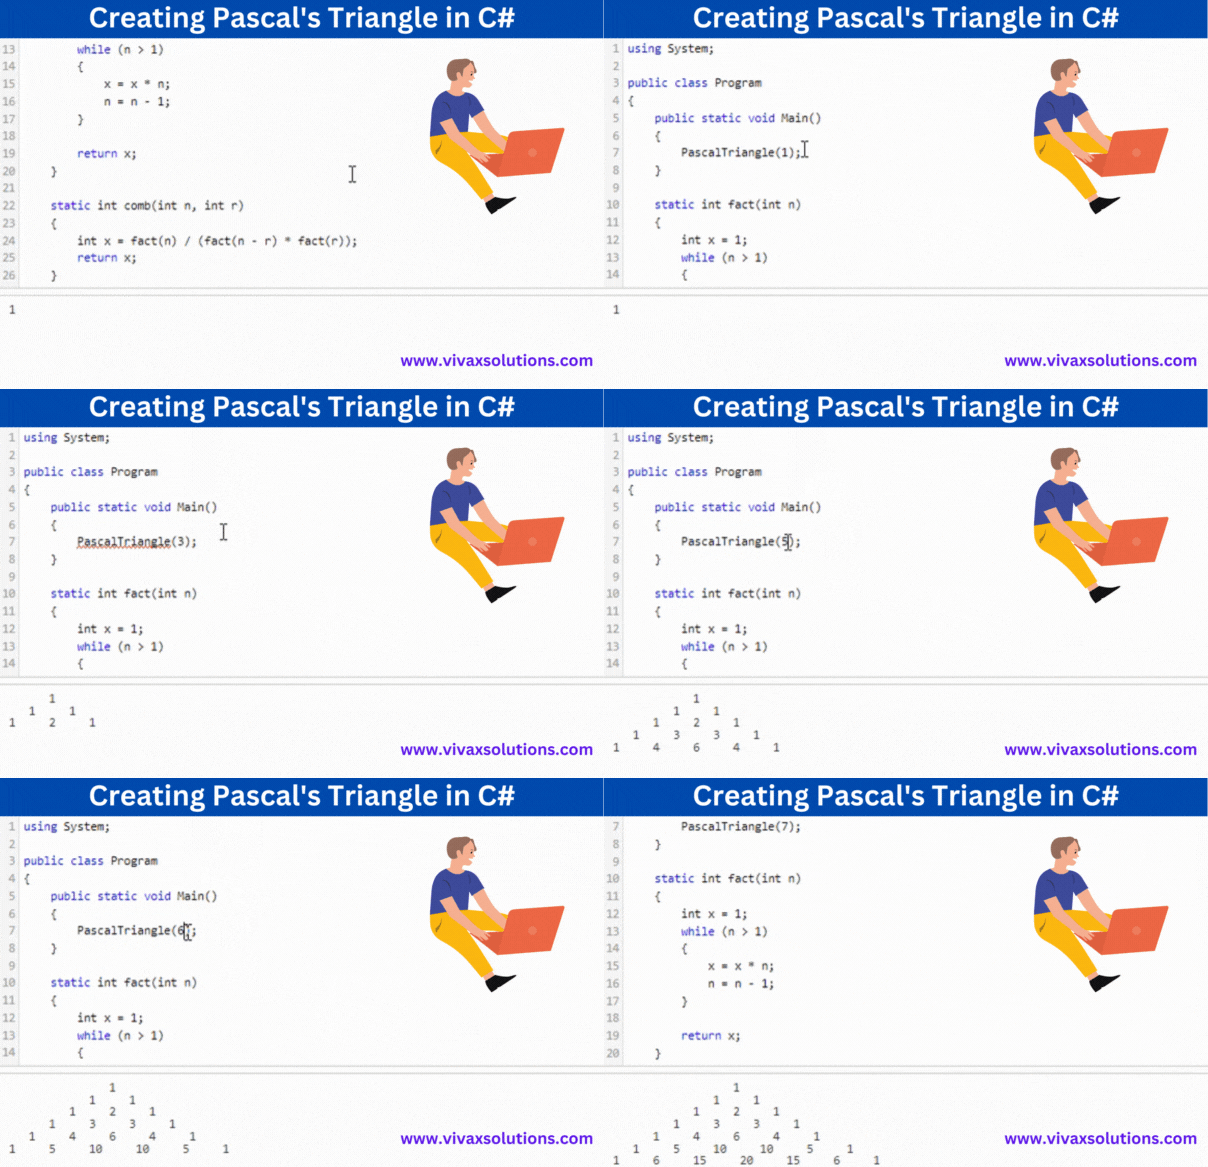
The above animation is produced in C# programming language for students who do computer science at GCSE, IGCSE, IB and A Level. The code snippet consists of four major function that collectively produce the Pascal's Triangle. They are: A factorial function A function to generate combinations A funct…
Straight Line Graph Generator: for Year 9, GCSE Maths
The equation of a straight line is given by the formula, y = mx + c, where m and c are the gradient and intercept respectively. The gradient, m, is the slope or steepness of the line; the intercept, c, is the point where it crosses the y-axis at. E.g. A straight line passes through (1,2) and (3, 8). F…
Constructions for Maths: GCSE, IGCSE and GCE - OL
A circumcircle is a circle that touches the three vertices of a circle from outside. It can easily be constructed by the following steps: Construct the perpendicular bisectors of each side of the triangle Locate the point of intersection of the bisectors The point of intersection is the centre of the c…
Monday, 19 December 2022
Correlation and the Line of Best Fit - for GCSE, IGCSE and A-Level Maths
The above animation shows how a code snippet written in JavaScript determines the line of best fit for an evolving set of data. The line is drawn accurately while performing the mathematical requirements for it to be accurate and minimizing the known errors. This is a stepping stone to AI - Artificial…
Sunday, 18 December 2022
Solving equations by iteration - GCSE, IGCSE and A Level maths - using Python
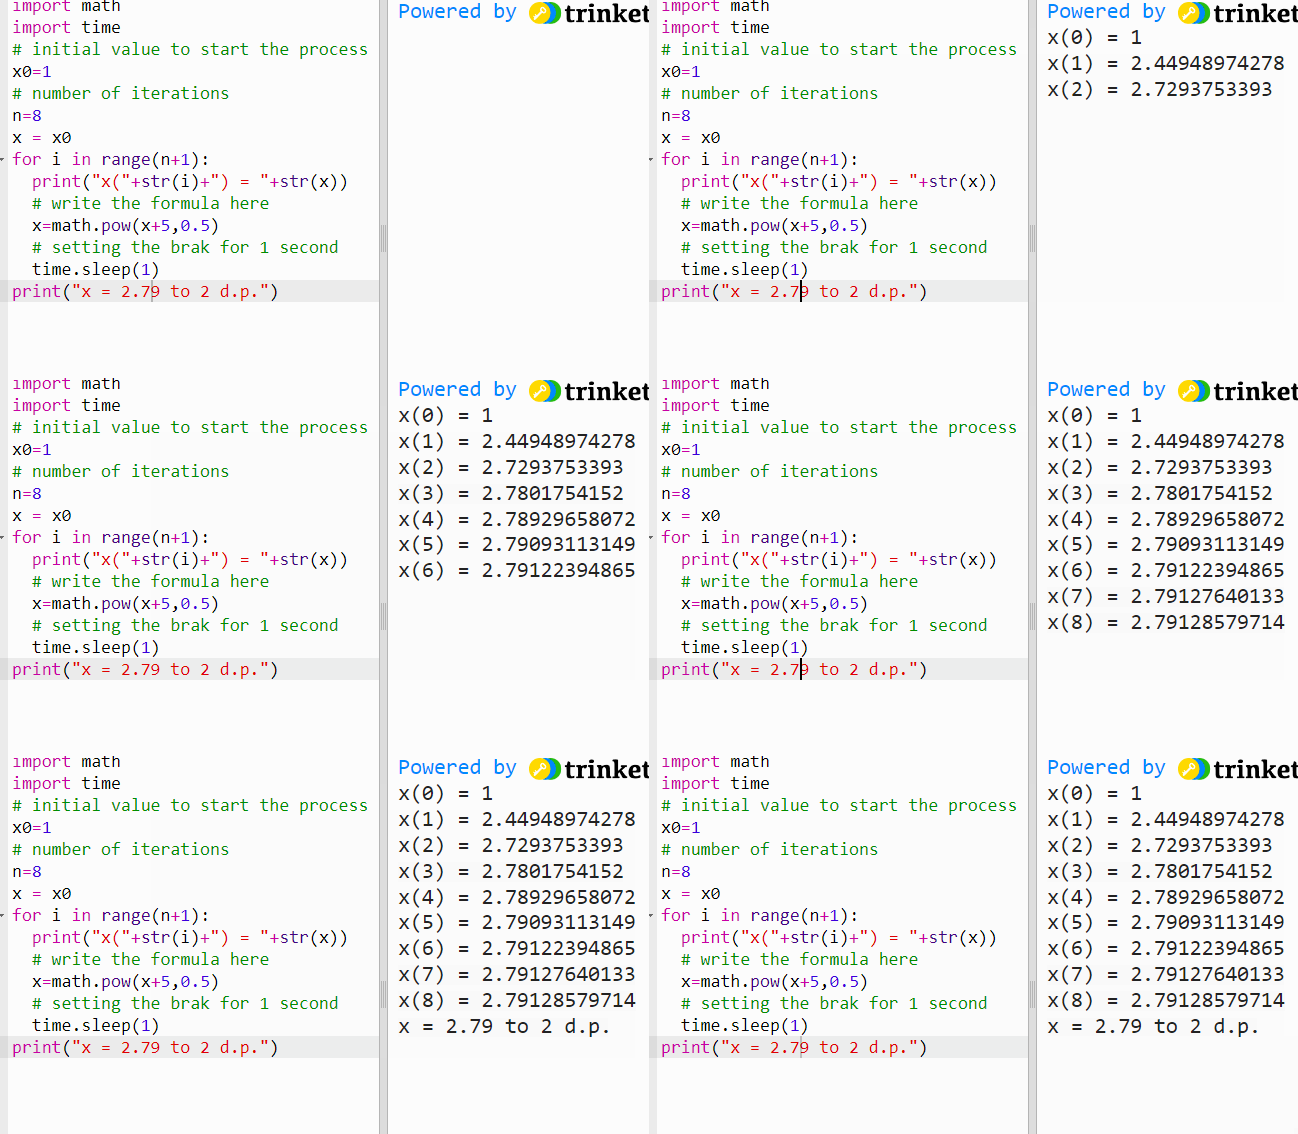
Iteration If f(x) =0, it can be rearranged in the form of x = g(x), where both f(x) and g(x) are functions of x. Then x = g(x) is said to be in iterative form. E.g. x² - x - 5 = 0 x² = x + 5 x n+1 = √(x n + 5) - f(x) = 0 in iterative form If x n is known, x n+1 can be calculated. The above is not the only ite…
How to measure atmospheric pressure by a mercury barometer - a toxic legacy!
The pressure of a liquid column is given by the formula, p = hdg, where h, d and g are the depth/height, density and the acceleration due to gravity respectively. A few decades ago, in order to measure the atmospheric pressure, a simple barometer was used. It consisted of a thin, long, glass tube -…
Saturday, 17 December 2022
Differentiating Trigonometric Functions
When it comes to differentiating the functions of sin x and cos x, we need to use two fractions of the functions in question, when the variable approaches zero must be considered. They are as follows: lim sin (x) / x, as x → 0 lim (cos x - 1) / x as x → 0 Based on the above, sin x and cos x can be dif…
Subscribe to:
Comments (Atom)
Popular Posts
-
Multiple Choice Questions - A Level Physics and Mechanics - Time: 40 minutes Created and Programmed by Vivax Solutions St...
-
In the above animation, five points on the wave are considered for the explanation. The fully interactive applet is given below for you ...
-
Multiple Choice Questions - A Level Physics - electricity - Time: 40 minutes Created and Programmed by Vivax Solutions Star...
-
Denary to Binary Conversion Denary to binary conversion is a fundamental concept in computer science and digital electronics. It involves t...
-
Multiple Choice Questions - A Level Physics - Capacitors - Master capacitor concepts with this interactive A Level Physics quiz! Whether...
TOP CATEGORIES
- a level computer science (11)
- a level physics (43)
- gcse maths (30)
- gcse physics (14)
- general physics (11)
Featured Post
Labels
a level computer science
(11)
A Level Maths
(27)
a level physics
(43)
featured
(4)
GCSE Computer Science
(9)
gcse maths
(30)
gcse physics
(14)
general physics
(11)
math
(2)
physics
(2)
Blog Archive
-
▼
2022
(77)
-
▼
December
(10)
- Differentiation: problem solving
- Pascal's Triangle in Python for Computer Science: ...
- Straight Line Graph Generator for Maths Teachers: ...
- Creating Pascal's Triangle in C#: for computer sci...
- Straight Line Graph Generator: for Year 9, GCSE Maths
- Constructions for Maths: GCSE, IGCSE and GCE - OL
- Correlation and the Line of Best Fit - for GCSE, I...
- Solving equations by iteration - GCSE, IGCSE and A...
- How to measure atmospheric pressure by a mercury ...
- Differentiating Trigonometric Functions
-
▼
December
(10)


